![]()
![]()
![]()
![]()
|
|
|
|
|
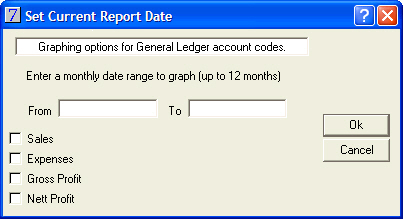
The General Ledger Graphs displays sales, expense, gross profit and net profit totals within the selected date range.
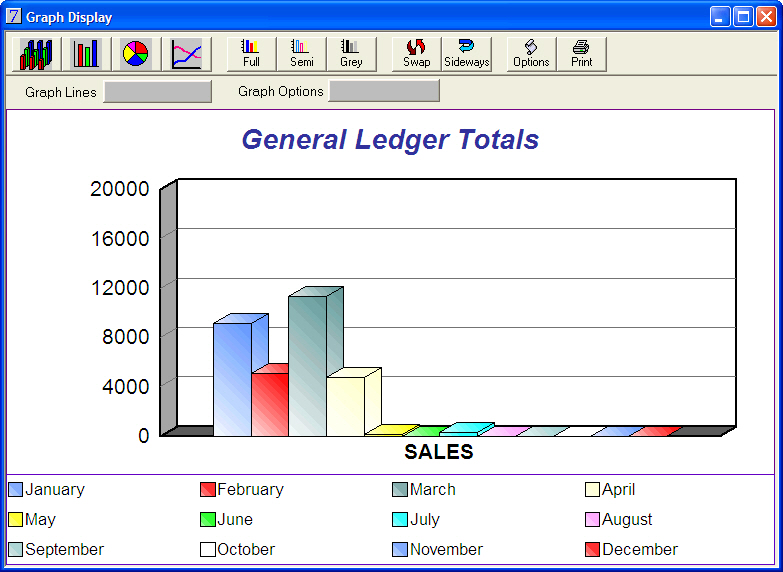
The toolbar on the Graph Display offers several different options.
Button |
Action |
|
3D Bar Graph |
|
Bar graph (default) |
|
Pie Chart |
|
Line Graph |
|
View and Print in full colour (including coloured background) |
|
View and Print in semi-colour (coloured graph, white background) |
|
View and Print in greyscale |
|
Swaps the x axis objects |
|
Flips the graph on its side |
|
Displays full graph options |
|
Prints the graph as it is displayed |
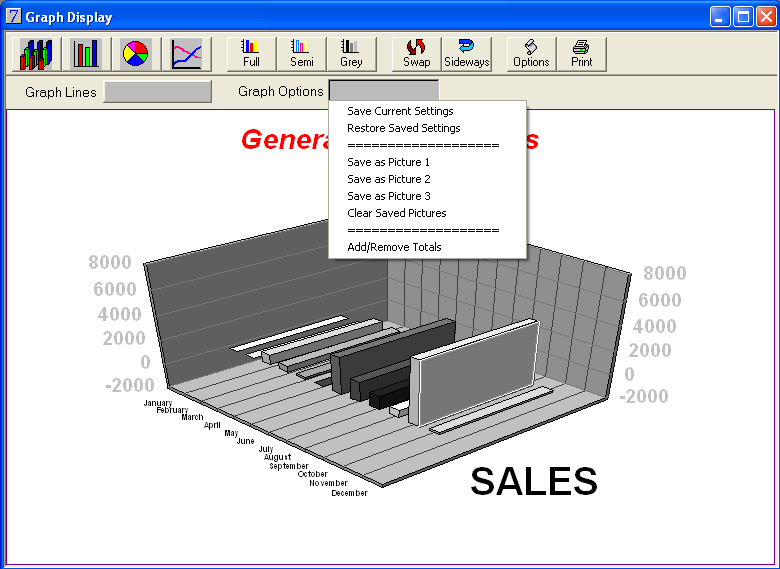
Click on Graph Options to display a drop down list of options for saving the graph.
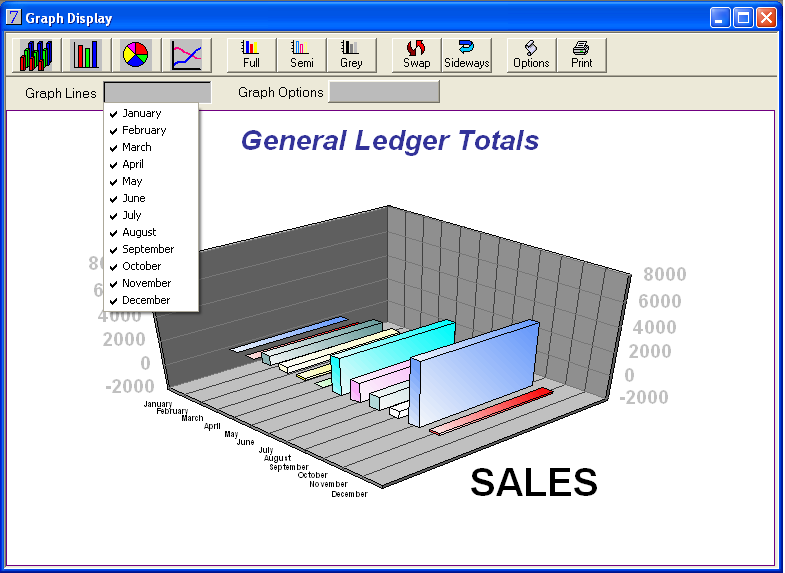
Click Graph Lines to choose which lines you wish to have removed from the display.
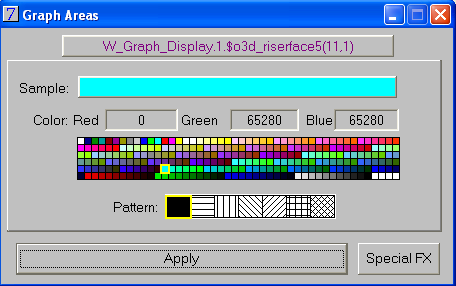
The graph display can also be adjusted by double-clicking on parts of the graph and selecting options from the screen displayed:
Click Apply to apply the selected option.
The Special FX button gives access to further display options:
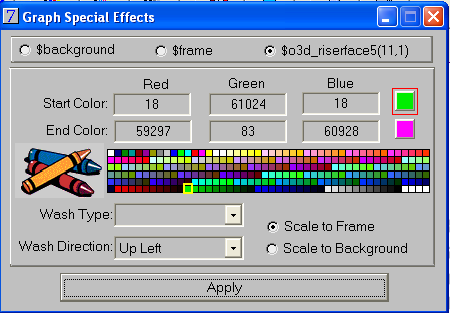
The graph will print as it is displayed.
See Also |


