![]()
![]()
![]()
![]()
|
|
|
|
|
It's easy to see who spent the most money with your practice over the past year. This might include clients with sick pets, wellness consults and referrals. Often these top sales figures tend to ignore clients still visit on a regular basis but don't spend as much.
The Sales Reports - Monthly Statistics allow you to generate a wide matrix of views, grouped by client, vet, clinic, sales group, and more.
Go to: Clients Module > Reports Menu > Sales Reports > Monthly Statistic
In this case, we will analyse the past year and set the Primary Grouping = Client
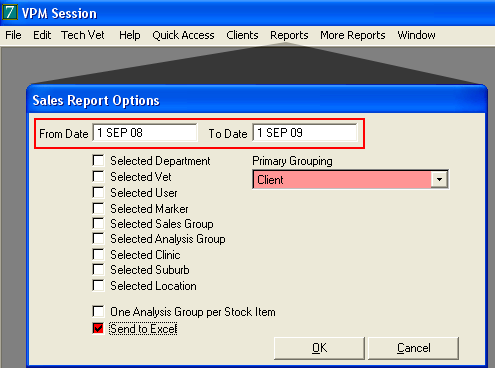
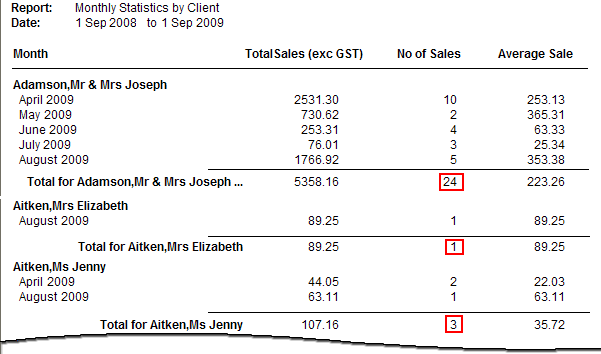
These parameters would normally generate the following report that highlights No. of Sales per client, as well as Total Sales and Average Sale. To sort these results by highest frequency of visit, you can Send to Excel.
By sending to Excel, you can sort, filter and find the information that suits you.
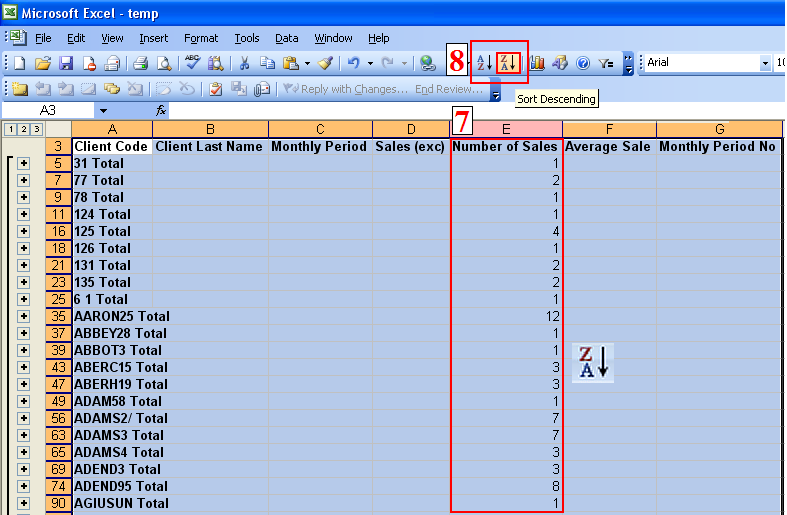
If you follow the steps below, we will count the total number of visits for each client and then re-sort by highest frequency of visit. Don't be surprised to find Cash Sales at the top of the list – although as a goal, cash sales should be minimised to help track buying behaviour and manage patient compliance.
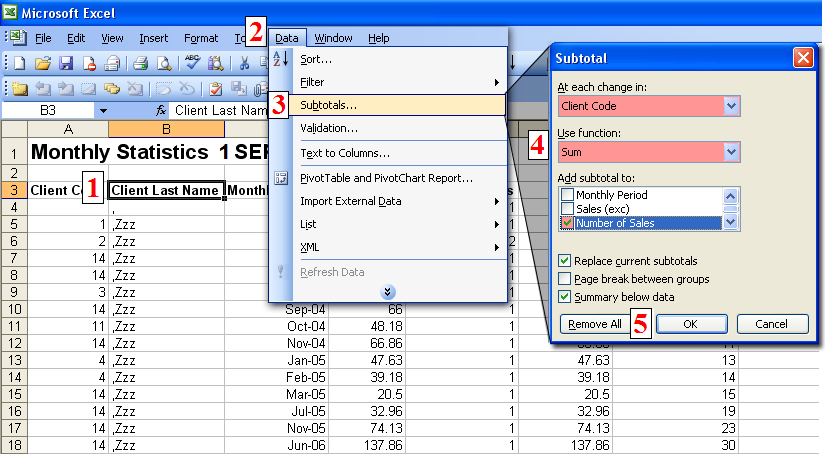
This will produce a view that has been restructured to show 3 different levels of subtotals.
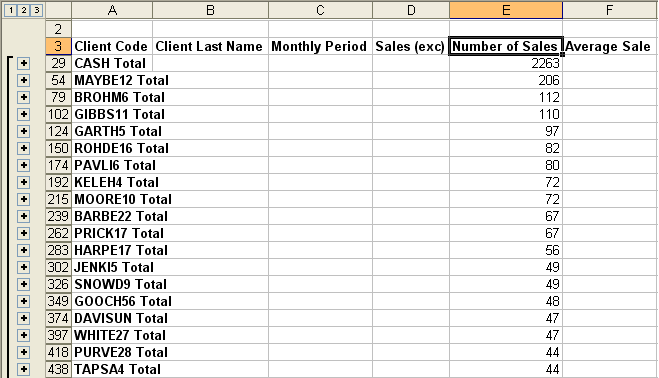
We are not interested in each individual visit, so in the next step we will condense the view to the level of the Client Code.
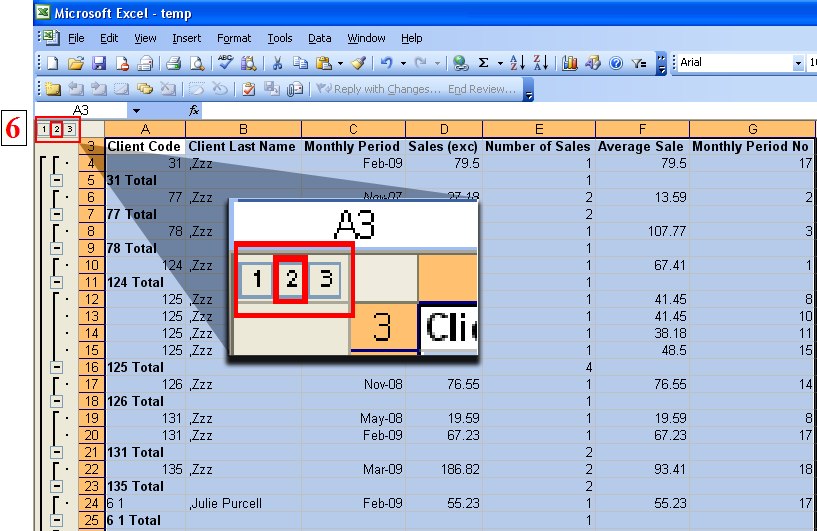
This will show the clients who have the highest frequency of visit. Don't be surprised if many of your top clients are actually your staff! By generating this report you can recognise those bonded clients who visit the practice on a regular basis. Is this your invitation list for the next Christmas party?
When you generate this report, don't forget you can use your client Marker to perhaps see a list of Equine clients Vs Small animal clients. You may wish to identify the clients for each department or clinic.
See Also |